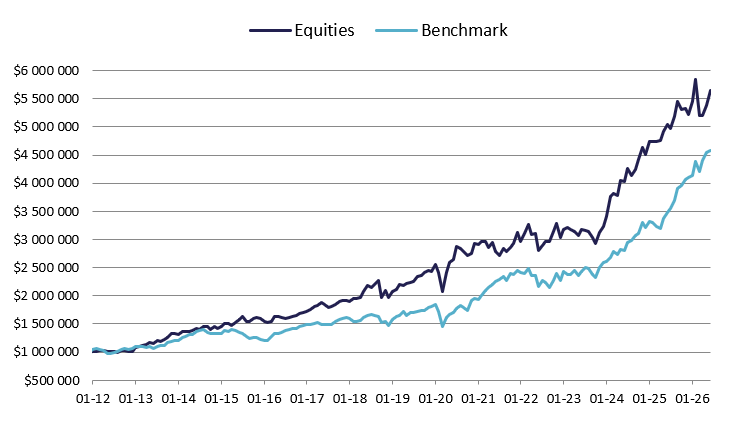
Performance

Equities
June 30th, 2026
Description
At Rivemont, we believe that the price of an asset is not always equal to its intrinsic value since the price is influenced by several factors, including several cognitive biases on the part of investors. Since these biases are known, and repeat themselves over time, it is possible to make investment decisions based on these recurring behaviors. We rely on momentum-based strategies including technical analysis and trend monitoring. The manager uses a top-down approach by establishing first which sectors have the highest growth potential to subsequently, within these identified sectors, to select specific securities. The strategy maintains a healthy diversification and constraints are in place to manage risk.
Performance (%)
1 mo.
3 mos.
6 mos.
YTD
1 yr
2 yrs
5 yrs
10 yrs
Incept.
Equities
4.9%
8.3%
8.1%
8.1%
11.8%
18.2%
15.2%
13.3%
12.7%
Benchmark
0.8%
8.9%
11.8%
11.8%
31.8%
27.8%
15.2%
13.1%
11.1%
2012
2013
2014
2015
2016
2017
2018
2019
2020
Equities
1.2%
32.0%
6.7%
12.7%
5.9%
13.1%
2.7%
23.1%
20.8%
Benchmark
6.9%
12.7%
10.4%
-8.3%
21.1%
9.1%
-8.9%
23.2%
7.7%
2021
2022
2023
2024
2025
2026
Equities
6.6%
-2.8%
6.2%
39.5%
15.9%
8.1%
Benchmark
25.6
-7.2%
13.9%
24.4%
27.6%
11.8%
Explanatory notes
Returns are from the composite of all equities held by the private wealth clients of Rivemont under representative code Q2F2 and are gross of fees. Before January 1, 2019, the benchmark is made up of 100% of the S&P/TSX Composite Index and, thereafter, of 80% of the S&P/TSX Composite Index and 20% of the S&P 500 Index. Future investment results will differ from past results. This document does not constitute a recommendation nor an investment advice and is presented for information purposes only.

Top individual holdings
- Chartwell Retirement Residential
- Gilead Science Corp
- Element Solutions Inc.
- Manulife Financial
- Citigroup
- Badger Infrastructure Solutions
- SkyWater Technology, Inc.
- Banque de Montreal
- Great West Lifeco Inc.
- Howmet Aerospace Inc.
Sectors of activity
Consumer Discretionary
0,0 %
Consumer Staples
0,0 %
Energy
0,0 %
Financials
26.7 %
Healthcare
18.0 %
Industrials
15.2 %
Information Technology
5.3 %
Materials
10.8 %
Real Estate
23.9 %
Telecommunication services
0.0 %
Utilities
0.0 %
Portfolio Manager
Martin Lalonde, MBA, CFA, is the portfolio manager responsible for the investment decisions. He has many years of experience in the financial markets and held, before founding Rivemont Investments, the position of senior analyst, investment, mergers and acquisitions for a major Canadian agency.

About Rivemont
Founded in 2010, Rivemont is a portfolio management firm with around $158 million in assets under management. The firm offers performing investment strategies to a private wealth clientele, brokers, consultants and financial planners.
