

Click here to download the financial letter in PDF format.
Introduction
Hello everyone,
Five years already!
Five short years ago, Daniel, Marc-André, Jonathan, Brigitte, Jean-Paul, Patrick and François placed their trust in our new firm, Rivemont Investments, by investing all of their savings with us. Thank you again for believing in us. We have come a long way since those humble beginnings.
To be solely responsible for the savings of an individual is a commitment that I have not taken lightly. I believed deeply that the investment strategies that I developed during the previous ten years would allow my new clients to become richer if they chose me as their manager.
And this has been the case. Rivemont Investments has achieved what few can boast: a higher return than the benchmark for all types of portfolios. According to the S&P Spiva Report of December 31st, 2014, only 2.9% of actively managed U.S. mutual funds outperformed the S&P 500. I was always confident that I would one day be part of the elite in the field of finance. It was not overconfidence, but a firm belief in pushing myself, and pushing myself some more, to look for these particular stocks that make all the difference in the portfolios we manage. May the next five years be as enjoyable for me and profitable for you.
In this financial letter, I will give an overview of our performance in the second quarter, including our new Rivemont Absolute Return Fund which ranked among the best in Canada in June. I will then give you my opinion on Bombardier’s stock in the section entitled “Nortel – Research In Motion – Bombardier”. You can probably guess that my opinion is less-than-positive. As usual, I will conclude with our outlook on the market and preferred securities in our portfolios.
Happy reading!
Performance
The second quarter proved to be very interesting on the North American markets. Volatility, which was almost zero in recent quarters, began to increase. One should remember that volatility is not always a negative thing for markets. Volatility is, in a few words, a simple calculation of the fluctuation in prices between certain periods. So, what can be a source of concern for some investors translates into great opportunities for others. We were, again, not very active during the quarter. It seems that the choices we made several months ago are still the most effective in this type of market.
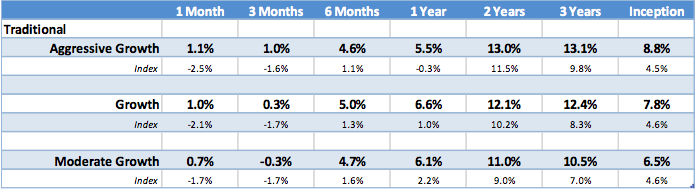
Over the past 3 months, we managed to outperform the benchmark indices by more than 2%. If we extend our analysis over the past year we beat the indices by almost 5%. The table below shows the difference between the profitability of our portfolio consisting primarily of equities (90% equities and 10% bonds) and its benchmark (90% S&P/TSX Capped 10% Dex Bond):

For the past year, the index has been relatively stable while the momentum of our growth continued. One of the main factors behind this performance is a significant exposure to the U.S. market, which includes a significant currency gain and the absence of any security closely or remotely related to the mining and oil sectors. We had a few stocks in the pharmaceutical sector, but we believe that the risk is now too high in this market segment. The elastic is dangerously close to breaking, and it would not be surprising to see a fall in the price/earnings of these companies.
At present, we are underweight in equities by about 10% and in bonds by 15%. Our liquidity position has rarely been higher and sits between 15% and 20%. Several stocks have stabilized their uptrend and alternate between the continuation of the uptrend and the beginning of a downtrend. The S&P/TSX Canadian Index is down 7% from its peak of 15,685 points last August and now stands at around 14,600 points. Unless there is a large and improbable increase in oil prices, I still do not think the Canadian market presents a buying opportunity in the short or medium term.
The performance of the Rivemont Absolute Return Fund has been relatively stable in the second quarter. It holds long and short positions in Canadian and U.S. markets. So essentially it is doing what is expected of it: to be solid in uncertain times. For those who might be interested, I invite you to visit the following link to the weekly monitoring of fund performance on the Globe and Mail website:
http://www.theglobeandmail.com/globe-investor/funds-and-etfs/funds/summary/?id=32300
On this page, you can compare the fund’s performance with its group and index, and plot its growth. This is an effective way, in my opinion, to monitor the fund.
Nortel – Research in Motion – Bombardier

It is difficult for me not to devote a few lines of this newsletter to talk about Bombardier stock. This is the stock about which my opinion has been the most solicited in recent months, perhaps, unfortunately, because it is one of the most commonly-held stocks by Québec investors. So I’ll explain why no one should have held this stock for the past 5 years.
First, there is an important behavioral bias among investors called the “bias of proximity”. Although there is no valid reason to favor a company in our region over another, individual investors have a habit of thinking that since they “know” a company better, it is a better investment. But this approach presents two big problems. The first is that investors’ “knowledge” is often superficial. Often I ask for Bombardier’s market capitalization, annual sales or their profits. Unless we stick strictly to technical analysis (although no technical analyst would hold this stock for reasons which I will explain shortly), we need to know these details, at the very least, in order to be able to judge the market’s evaluation of the company’s future cash flow. Thinking that the situation will eventually improve is rarely sufficient analysis.
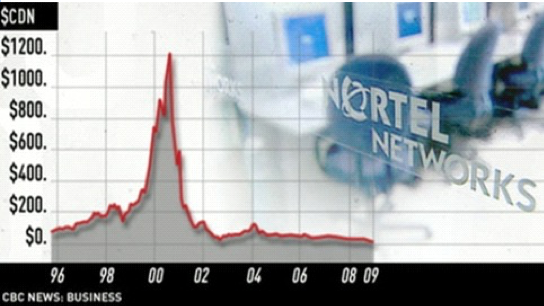
However, if I included Bombardier, Nortel and Research in Motion in the title of this section, it is mainly due to the second problem. Often, a company that is “known” to the investor remains one of those they “know” the best. This makes it difficult to dispose of it, as the emotional cost is high. It also makes it easier to give it a second chance. As you know, the time of sale of a security is as important as the time of purchase, so it is essential not to have biased judgment. It is partly for this reason that certain securities in our portfolios are unknown to many investors (FactSet Research, Sirona Dental, etc.). We are indifferent to the location and the name of the companies in which we invest. Only the possibility of eventual profits are important to us.
Fortunately, there are simple ways to avoid the trap of securities on a downtrend. The two main ways are to look at increases in revenue and to monitor the 200-day moving average.
The first way is pretty intuitive. If there is no increase in revenues quarter over quarter, the stock will never soar to new heights. It’s a difficult signal to ignore. It is important not to try to predict when an increase in income will occur. If it is absent, we sell it.
The second way is even more effective. Paul Tudor Jones is one of the greatest investors of all time. He currently manages more than $10 billion and is recognized for having greatly increased his wealth in the wake of the famous stock crash of 1987. I was shocked to learn that we share one very important rule in the management of our assets. In a recent book by Tony Robbins entitled Money: Master the Game, Tudor explains how to avoid heavy losses: “My metric for everything I look at is the 200-day moving average of closing prices. I’ve seen too many things go to zero, stocks and commodities. The whole trick in investing is: ‘How do I keep from losing everything?’ If you use the 200-day moving average rule, then you get out. You play defense, and you get out.”
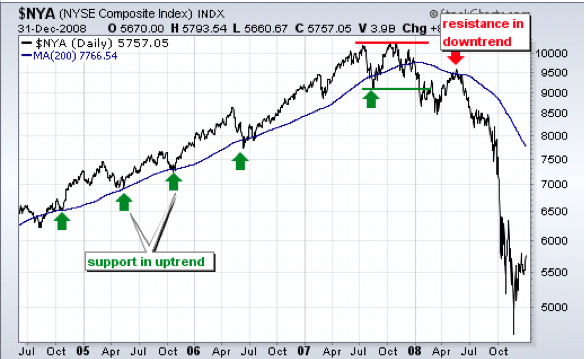
Rivemont uses this technique systematically. In the chart below, where the blue line represents the 200-day moving average, one can clearly see the trend reversal in 2008. It was a clear signal that the stock market was no longer on an uptrend. It is usually very wise and profitable to be attentive to market technical signals.
It is clear that, for a long while now, Bombardier has failed to remain above its 200-day moving average, which leads to the conclusion that this stock should not, at present, be part of any portfolio. But even more important is the marginal cost of holding a stock like Bombardier, which is on a downward trend. It also means that part of our capital is frozen and cannot be invested in other securities that are on an uptrend. We lose twice. A stock does not become better when it is included in our portfolio; it remains a stock among others that is competing for a place in our selection. In the field of investment, we have to be very picky about the moves we make.
Market Prospects
| Subjet | Question | Recommendation | Comments |
|---|---|---|---|
| Allocation between equities and fixed income securities. | Which are most interesting, stocks or bonds? | Neutral weight in both asset classes. | We recommend adding alternative investments to portfolios. |
| Distribution between Canadian, U.S. and international. | Which markets are most interesting: Canadian, U.S. or international? | U.S. stocks are still interesting. | Several emerging markets are no longer on an upward trend. |
| Distribution between corporate bonds and government bonds. | Which are more interesting, corporate bonds or government bonds? | We recommend corporate bonds and government bonds. | We recommend short and medium-term corporate bonds and Canadian government bonds. |
| Investments in Canadian dollars or in foreign currency. | Do investments in other currencies increase or decrease the total yield? | The increase in the Canadian dollar should be modest and insufficient to discourage diversification abroad. | No upward movement of the Canadian dollar is expected in the medium term. |
Favorite Securities
You will find below a list of the eight individual securities with the largest weight in our “growth” portfolio. These stocks were selected based on their respective potential to outperform the stock market. You will find a short description of their activities, the annual dividend, if any, and the total return since their first inclusion in our portfolio.
Dated : April 28, 2015.
1 – LennarSymbol: LEN |
5 – AGT Food and IngredientsSymbol: AGT |
2 – Sirona Dental SystemsSymbol: SIRO |
6 – Horace Mann EducatorsSymbol: HMN |
3 – Factset Research SystemsSymbol: FDS |
7 – Sun Life FinancialSymbol: SLF |
4 – AppleSymbol: APPL |
8 – People’s United FinancialSymbol: PBCT |
Conclusion
It is with pleasure that I invite you to visit our new website at www.rivemont.ca. Although the information remains essentially the same, we adopted a new, more modern and user-friendly look for mobile devices.
Several interesting projects await us in the coming months, and we will of course keep you informed of these developments. Our goal is always to be the best performing firm, while strictly respecting the risk profile of our investors. We believe we have achieved this during our first five years of existence and the stage is set for the next five to be equally successful.
Sincerely,
Martin Lalonde, MBA, CFA
President


