

Click here to download the financial letter in PDF format.
Introduction
Hello everyone,
The year 2014 is behind us and we can now reflect on how interesting it was in terms of investment decisions.
Several obstacles arose in the markets, especially in the second half of the year. At the same time, 2014 offered many opportunities that allowed us to finish in positive territory for all types of portfolios.
In this newsletter, I will give a summary of 2014 and an overview of our hits and misses over the past twelve months. I will continue with the presentation of our performance this year and discuss, in the same section, our performance since our inception. As you can imagine, this is the part that I particularly enjoy. As always, I will conclude with our outlook on the market and preferred securities in our portfolios.
Before you read the financial letter, I would like to tell you about an event I attended on January 14. In collaboration with the Alternative Investment Management Association of Canada (AIMA Canada) and HEC Montréal, I had the opportunity to be one of the expert panelists to speak with Masters students from this establishment and answer their questions. The panel also included a senior executive of PSP Investments, the firm responsible for managing the federal public service’s pension fund, a senior representative from Bimcor, the firm that administers Bell Canada’s pension fund, and another hedge fund manager from the province of Quebec. This event made me realize how far Rivemont Investments had progressed in five years, back when we were a small Gatineau-based startup. Our expertise is now recognized throughout Quebec and Ontario, and our customers come from several major cities in those provinces. In addition, we currently have more than $20 million of assets under our management, which increased by almost 40% in 2014.
It is with confidence that we are entering a new phase in our growth cycle. The management of the Rivemont Absolute Return Fund is directly in line with this goal and will allow us to broaden our customer base, which may soon include the integration of some institutional assets. However, our main goal is, and always will be to offer our clients the best possible return based on their risk tolerance. Our performance remains our most effective marketing tool.
Happy reading!
The year 2014
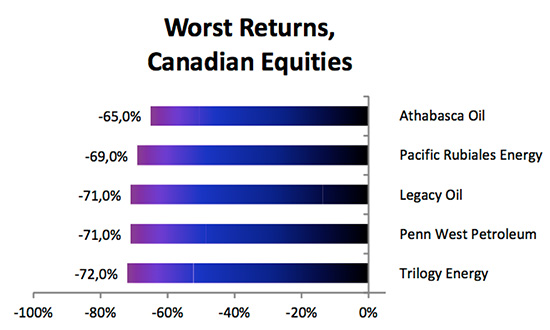
When it comes to the Canadian stock market, we can easily divide 2014 into two distinct parts: before and during the significant drop in oil prices. Oil reached a high of US $107.73 in June and then collapsed consistently and dramatically finishing the year at US $53.73, down 50% in 6 months. Unfortunately for Canadians, the energy sector, which previously represented 25% of the S&P TSX, now only represents one fifth of the exchange. Obviously, the sharp decline in oil prices has had a huge negative impact on companies in this sector, which includes 2014’s five worst performers on the Canadian stock market.
On a positive note, mergers and acquisitions have had the most impact on the Canadian market. First, the US giant, Burger King, and the Canadian leader, Tim Hortons, merged in August. Tim Hortons shares rose from $58 in January to $86 in December, when they were delisted, for a gain of 48%. US media covered this transaction for two reasons. First, because this merger was partly funded by the Oracle of Omaha, Warren Buffett, and secondly because it was decided for tax reasons to locate the headquarters of the new entity on Canadian soil. The year 2014 saw several major US corporations take advantage of the acquisition of foreign companies to avoid paying higher US taxes, a move referred to as a conversion. Although some measures have been taken to slow this phenomenon, it is quite possible that it will continue in the coming years.
The most spectacular acquisition of 2014 had to be the one made by a small business in the west of Montreal called Amaya, who purchased the online poker giant Pokerstars for almost $5 billion. On December 31, 2013, Amaya shares were trading at $7.95. By the end of 2014, they were trading at $28.55, an increase of 341%! Unfortunately for our customers, we were not shareholders of Amaya. However, we do not possess shares in oil either, which is still a balm on any regrets we might have had.

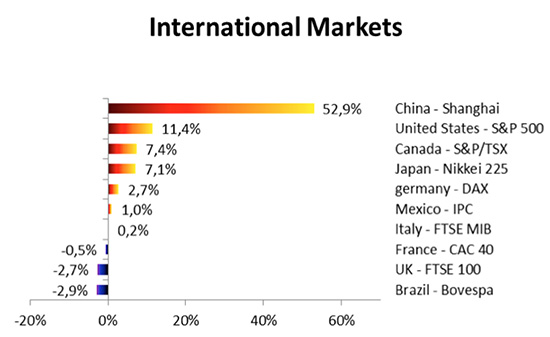
Major exchanges in developed markets have produced mixed returns in 2014, with the exception of the market in Shanghai, China. Indeed, China’s Class A shares generated a return of over 50% in 2014. However, it is a market in which it is rather difficult to invest, and exchange traded funds that invest in China generally had a much more modest performance during the same period. The United States have once again outperformed a Canadian market that was hit by the falling price of natural resources. Europe, for its part, had a rather difficult year with France and England ending in negative territory. We expect the same scenario for 2015.
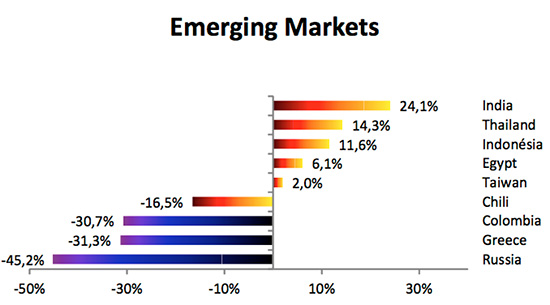
In terms of emerging markets, the biggest loser is definitely Russia, whose economy has been hit hard by falling oil prices and Western sanctions. South America has also been hit hard by falling commodity prices and the election of left-leaning leaders. The economies of Southeast Asia for their part, continued to be successful and should be an important source of global growth. We are monitoring these markets closely for investment opportunities in 2015.
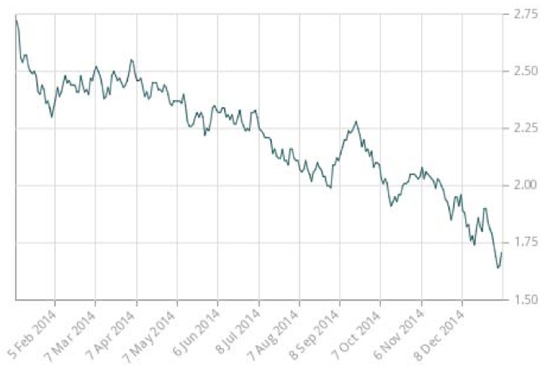
Contrary to our expectations, interest rates continued to decline in 2014, while the rate of government 10-year bonds dropped from 2.77% to 1.79%. The graph below, taken from the website of the Bank of Canada, clearly indicates that downward trend. As such, bonds performed very well in 2014. This fact demonstrates the importance of not eliminating certain asset classes despite negative forecasts. The market always finds a way to surprise us.
Finally, I cannot conclude without mentioning the Canadian dollar and its 8.5% decline against the US dollar and 4.3% decline compared to the Euro. Since weak oil prices are at the origin of this fall, the Canadian dollar should stabilize in the coming weeks. Overall, the impact was positive on investments in 2014, foreign investments increasing by the same percentage.
Performance
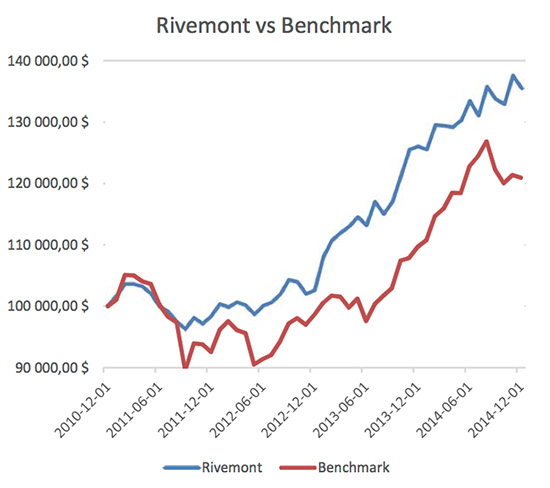
Like the Canadian market, our performance for 2014 can be divided into two parts. In the first nine months, we were very conservative, and the Canadian stock market outperformed us by 6 to 8%. However, we successfully predicted the sharp decline that occurred in October and have subsequently invested heavily in the US market. In addition, we have avoided stock in natural resources. So we did catch up and our stock-based portfolios were within 1% of the index for a yield of 9.3%. Since our inception, for the same type of portfolio, we have exceeded our benchmarks by nearly 4% annually, which is pretty impressive. Indeed, a recent study has shown that very few managers have accomplished this feat. Here is a chart that shows the growth difference between Rivemont Investments and our benchmark index:
You can see the details of our performance at any time in our performance section.
Hits and Misses
As I have already explained, there are three main ways to change a portfolio relative to its benchmark: to change the weighting of asset classes, change security selection within asset classes and geographically diversify the portfolio. Here is an update on the state of our portfolios in 2014.
Weighting of Asset Classes
We were underweight in bonds and slightly underweight in equities. Strong bond yields on the markets have slowed our growth compared to the index. As for stocks, we carefully analyzed the market and judiciously decided to sell Canadian shares at the right time. The addition to the portfolio of alternative investments in 2015 is expected to decrease volatility and, hopefully, increase yields.
Stock Selection within Asset Classes
Regarding bonds, we sold the high-yield bonds before their decline and purchased Canadian government bonds, which performed quite well. In terms of equities, unlike in previous years, our portfolios did not hold 2014’s highest performing stocks.
Fortunately, however, we no longer held oil or gold stocks, which allowed us to pull our chips out of the game at the right time. We have been very conservative, especially with respect to US securities, as evidenced by how quickly we sold several equities that did not give the expected results. The data tells us that if we had been more patient, these equities would have risen fairly quickly. However, we will not deviate from our philosophy, which is to sell losing stocks and keep the winners. Our priority is to protect our clients in case of rapid or prolonged decline in the markets. You don’t change a winning formula.
Geographical Diversification
Our decision to stay in North America was a good one as the Canadian and US markets produced some of the best returns in the developed economies. We continue to keep a close eye on Southeast Asia with the Philippine market back on our radar. Indeed, the Philippines is the country with the largest population growth, and we are waiting for the right moment to resume our position. Moreover, the Europe economy is, we believe, still sick, and countries such as Italy and Spain are likely to continue to undermine the growth of the old continent. This also applies to South America with Brazil, true to its old habits, never living up to expectations.
Market Prospects
| Sujet | Question | Recommandation | Commentaire |
|---|---|---|---|
| Répartition entre actions et titres à revenu fixe. | Est-ce les actions ou les obligations qui sont les plus intéressantes ? | Sous-pondération des deux catégories d’actifs. | Nous favorisons l’ajout d’une partie alternative dans les portefeuilles. |
| Répartition entre actions canadiennes, américaines et internationales. | Lesquelles des actions canadiennes, américaines ou internationales sont les plus intéressantes ? | Sous-pondération des actions canadiennes. | Le marché américain est toujours le seul marché développé en tendance résolument haussière. |
| Répartition entre obligations de sociétés et obligations d’États. | Lesquelles des obligations de sociétés ou d’État sont les plus intéressantes ? | Recommande les obligations de sociétés et les obligations gouvernementales. | Nous recommandons les obligations corporatives de courtes et moyennes échéances ainsi que les obligations gouvernementales canadiennes. |
| Placements en dollars canadiens ou en devises. | Les placements en devises augmenteront‐ ils ou diminueront‐ils les rendements totaux ? | La progression du dollar canadien devrait être modeste et insuffisante pour décourager la diversification à l’étranger. | Aucun mouvement à la hausse du dollar canadien n’est prévu à moyen terme. |
Favorite Securities
You will find below a list of the seven individual securities with the largest weight in our “growth” portfolio. These stocks were selected based on their respective potential to outperform the stock market. You will find a short description of their activities, the annual dividend, if any, and the total return since their first inclusion in our portfolio.
Dated : January 23, 2015.
1 – AGT Food and IngredientsSymbol: AGT |
5 – LennarSymbol: LEN |
2 – Sirona Dental SystemsSymbol: SIRO |
6 – NxStage MedicalSymbol: NXTM |
3 – Factset Research SystemsSymbol: FDS |
7 – Horace Mann EducatorsSymbol: HMN |
4 – AppleSymbol: APPL |
8 – Hersha HospitalitySymbol: HT |
Conclusion
The year 2014 proved to be very interesting and helped, I believe, measure the quality of portfolio managers. Some of our competitors have been greatly affected by the fall in the prices of natural resources like oil, and even gold and silver. Large companies in the gold sector saw the price of their shares tumble since September. I am proud to have clearly stated in La Presse on September 3, 2014, that investors should avoid gold (see “Rivemont in the media” section on our website). The depth of our analysis, based on technical analysis and trend monitoring, continues to place Rivemont Investments among the best performing investment-focused financial institutions in Canada.
The Rivemont Absolute Return Fund that was launched in January 2015 is definitely another success that makes us particularly happy. As the only investment fund managed in the Outaouais region and one of the only hedge funds in Quebec, it allows accredited clients access to strategies typically reserved for Wall Street and its great wealth. And though our company continues to grow, we are committed to living up to the customer service expectations of our clients.
Sincerely,
Martin Lalonde, MBA, CFA
President


