

Click here to download the financial newsletter in PDF format.
Introduction
Hello everyone,
The first quarter of 2014 was marked by a surprising event, the magnitude of which most people have yet to grasp. On March 9, the U.S. bull market celebrated its 5th anniversary by setting new record highs. From its lowest level at 676.53 points on the S&P 500 index, it grew by over 175%, almost three times its value! Many of us still have vivid memories of the financial chaos that hung over Wall Street five years ago in March 2009. It was difficult to predict that this would be the perfect opportunity for a whole generation to invest in the stock market. At Rivemont Investments we don’t attempt to predict the future but we are able to see a turnaround when one presents itself and we are able to follow the trends with discipline and detachment. This approach has allowed us to take advantage of this unprecedented bull market more than most.
The first part of this financial newsletter examines the recent bull market in more detail, in particular by presenting lessons that we can learn and mistakes to avoid in the future. Some investors, to my knowledge, have not yet managed to recover everything they lost during the last recession, which in my opinion is unacceptable. They should now be well ahead, as is the case of clients who have trusted us in recent years.
In the second part of the newsletter, I will present our performance in the first quarter of 2014, in which our alternative Absolute Return strategy continued to produce impressive gains (+ 43% over the past 12 months). I will continue with a brief presentation of our view on emerging markets and why they are not very present – for now – in our different strategies. As usual, I will conclude with our outlook on markets and the composition of our current portfolio.
But before I begin, I would like to announce that Rivemont Investments is now a member of the Conseil des gestionnaires en émergence, a group of up-and-coming portfolio managers in Quebec who have less than $1 billion in assets under management. This is a valuable platform that aims to encourage large institutions to invest in successful local firms. The official launch of this group took place on April 24 at the Montreal Exchange. On another note, we now know the date of the transition of assets from TD Waterhouse to National Bank. It will take place on June 13 and, as promised, no action is required on the part of our investors since the transfer will be automatic. Do not hesitate to contact us with any questions you may have about this or any other matter.
Happy reading!
The Five-Year Bull Market
It should not be a surprise that the question that is on everyone’s lips is: “Are we witnessing the last gasps of the bull market which has boosted U.S. markets for 5 years now?” To answer this question, it is important to compare past bull markets with the current one. As Mark Twain said, history does not repeat itself, but it rhymes.
The following table lists each bull market since 1929. When prices rise by more than 20% over a given period, it is considered a bull market. The same percentage is used to characterize a bear market.
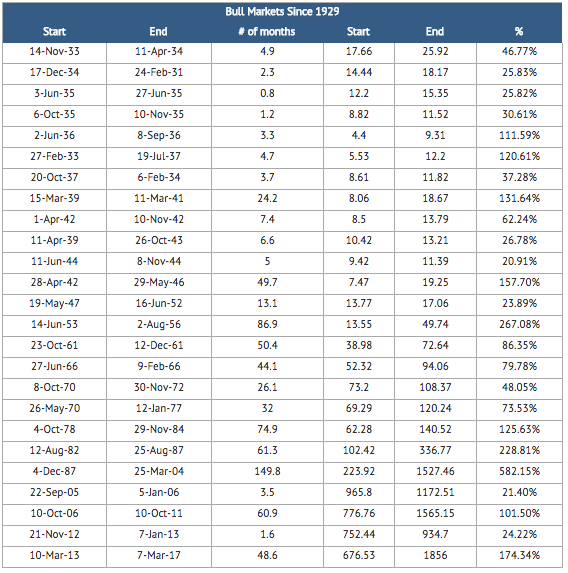
Based on this table, here are some points to consider:
- there have been 25 bull markets since 1929;
- the average length of such bull markets is 31 months;
- the average gain is 104% and the largest gain was of 582%, from 1987 to 2000; and
- the current bull market is in its 61st month and the cumulative gain is 175 %.
The only certainty we have is that a bull market is inevitably followed by a bear market. However, it is extremely difficult to predict a trend reversal. The mere fact that this market has increased by 175% is not a sufficient indication that we should liquefy our assets. An investor who would have taken this decision in the early 1990s would have missed out on one the most formidable decades for investing in stock. We must therefore focus more on the characteristics of the market to make an informed decision.
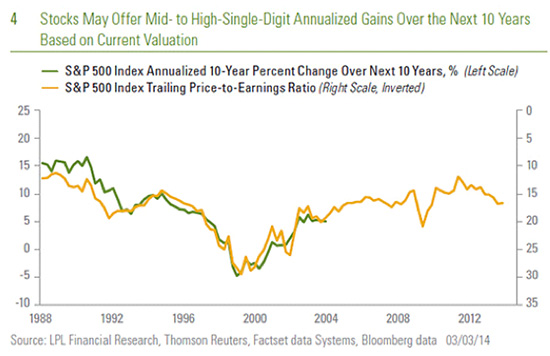
It is also possible to perform a quantitative analysis of the current cycle, as we can see in the following table from the Wall Street Journal. The left axis (green line) shows the annualized gain over the past 10 years and the right (inverted) axis (yellow line), the price-earnings ratio for the last 12 months. One can easily notice the strong correlation between the two indicators. It is therefore likely, from a quantitative point of view, that the next decade could offer average annual gains of about 10%, which is almost identical to the average of the last 100 years in the U.S. market.
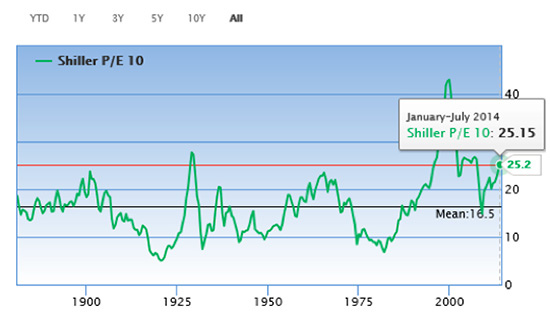
Another quantitative indicator frequently used is Shiller’s cyclically-adjusted price-earnings ratio (Shiller P/E). What is particularly innovative about this analysis is that it presents the gains of the last 10 years adjusted for inflation. This approach does not reflect the short-term volatility of the markets.
April 27, 2014
Shiller P/E: 25.2
Historical average: 16.5
Low: 4.8
High: 44.2
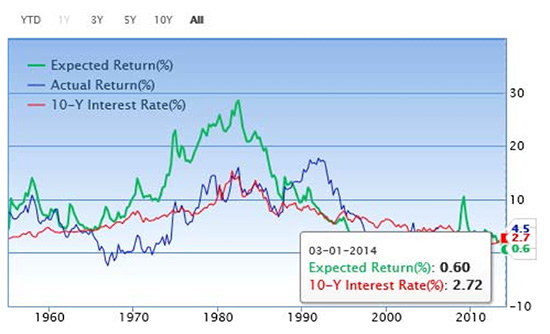
In this analysis, the higher the ratio, the lower the potential for future earnings. And since the ratio is currently 51% higher than the historical average, if we rely on this approach, we can expect minimal gains in equity markets over the coming years. On gurufocus.com they are estimating a yield of less than 1% per year, as shown in the following table:
At Rivemont Investments we agree that the potential gains in the U.S. market today are much less interesting than they were over the past 2 or 3 years. For this reason, we have significantly reduced our exposure to this market by selling the entire American index portion of our portfolios. These assets will be redeployed in the Canadian market and, possibly, in some emerging markets. The advantage of dealing with a private management firm like ours is that we are able to be active in the markets in order to take advantage of macroeconomic cycles inherent to stock markets. Our history of success shows that sectorial and geographical rotation enriches our long-term investors.
Performance
Net performance as of March 31, 2014

Rates for more than one year are annualized. The indices are based on the performance of XIC – S&P/TSX Capped Composite Index Fund and XBB – DEX Universe Bond Index Funds in the following proportions: Aggressive Growth (90% equities, 10% bonds); Growth (75% equities, 25% bonds); and Moderate Growth (60% equities, 40% bonds).
The yield is calculated net after all costs (management, custody and commissions).
Past performance is no guarantee of future results.
The last quarter was one of the least interesting ones for our company. The U.S. market has slowed while the Canadian market, which is our benchmark, saw amazing bullish momentum due to the favorable influence of the oil and banking sectors. We do not believe that this trend is temporary, which is why we have integrated new shares of these sectors into our portfolios, including Canadian Natural Resources (CNQ.to – oil and gas) recently and Royal Bank a few months ago.
Since the beginning, our portfolios have all been well ahead of their indices. For example, our growth portfolios have risen by 15.5% over the last 12 months, which is 5% more than their benchmark.
But our most impressive strategy, for some time now, has been the Absolute Return strategy. Since 1 January 2014, it has gained 17%, and 43.6% over the past 12 months. Do not hesitate to contact us if you believe that this particular strategy might be of interest to you.
Emerging markets
With the exception of the Philippines and Thailand in early 2013, we have avoided investing the assets of our investors in emerging markets in recent years, and history has proven that we were prudent to do so. The following table (from bespokeinvest.com) shows the relative strength of emerging markets compared to the U.S. S&P 500. In short, we could say that we were better positioned just south of the border than on the other side of the planet.
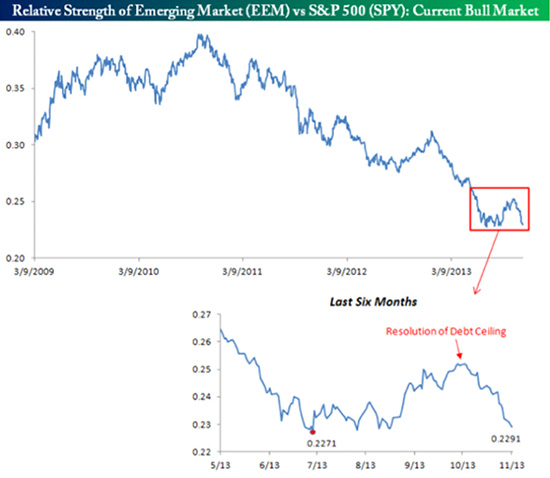
However, a wind of change is blowing. Emerging markets are now undervalued (on sale!) by nearly 40% compared to North American markets, on the basis of price-earnings ratios. It is therefore very likely that we will invest some of our assets in some of these countries in the coming months. We only expect this trend to continue and for some of these markets to reach new heights.
Market Prospects
| Subjet | Question | Recommendation | Comments |
|---|---|---|---|
| Allocation between equities and fixed income securities. | Which are most interesting, stocks or bonds? | Neutral distribution relative to benchmarks. | The increase of interest rates is still pending while the stock market has risen substantially. |
| Distribution between Canadian, U.S. and international. | Which markets are most interesting: Canadian, U.S. or international? | Preference for the domestic market and international markets. | Some emerging markets could initiate a bullish trend in the coming months. |
| Distribution between corporate bonds and government bonds. | Which are more interesting, corporate bonds or government bonds? | We recommend corporate bonds rather than government bonds. | We recommend short- and medium-term corporate bonds as well as high-yield bonds. |
| Investments in Canadian dollars or in foreign currency. | Do investments in other currencies increase or decrease the total yield? | The increase in the Canadian dollar should be modest and insufficient to discourage diversification abroad. | The decline in the Canadian dollar is expected to continue in 2014. |
Favorite Securities
You will find below a list of the eight individual securities with the largest weight in our “growth” portfolio. These stocks were selected based on their respective potential to outperform the stock market. You will find a short description of their activities, the annual dividend, if any, and the total return since their first inclusion in our portfolio.
Dated : April 25, 2014.
1 – Descartes SystemsSymbol: DSG |
5 – AutolivSymbol: ALV |
2 – Jean-Coutu GroupSymbol: PJC.A |
6 – Globe Specialty MetalsSymbol: GSM |
3 – Packaging Corporation of AmericaSymbol: PKG |
7 – RBCSymbol: RY |
4 – SterisSymbol: STE |
8 – Alliance Grain TradersSymbol: AGT |
Conclusion
The year 2014 should be quite interesting on the stock markets. We anticipate a significant flow of capital to underperforming markets while the U.S. market reaches new heights. The only area where a reversal of trends seems unlikely is that of precious metals. Indeed, this sector will need to consolidate before there is any hope for gold companies to return to real profitability. We also believe that Canadian oil and gas companies and the South-East Asian region have the most interesting technical trends. Obviously, strong diversification among the most attractive sectors is more likely to generate favorable results even if it could take some time before we have validation of our analysis. At Rivemont Investments, we believe it is better to have a clear picture sooner rather than later…
Sincerely,
Martin Lalonde, MBA, CFA
President


