

Click here to download the financial newsletter in PDF format.
Introduction
Hello everyone,
For the fifth consecutive year, I am pleased to send out this financial newsletter to communicate with our current and potential investors. Many of you have confirmed that this is a nice way to stay in touch. For me, writing the newsletter is a good way to share my ideas and provide a quick overview of our achievements. I must admit, of course, that it is always easier to write this newsletter when I have good news to share. Fortunately, this is the case again this year!
Indeed, in 2013, all of our portfolios exceeded their benchmarks by an impressive margin. On average, we achieved a yield that was 15% higher than the market. This type of performance is difficult to reproduce year over year. Of course, in order to create a roadmap for financial gains, which is what we are doing, the stars must align and global markets must behave as predicted and in a consistent manner. This was the case in 2013. For much of the year, none of the shares in our traditional portfolios were in negative territory, mostly because of the stunning growth of U.S. markets. In addition, we were able to avoid major financial pitfalls in sectors such as gold, resources and real estate in Canada.
I’ll begin this newsletter by providing a financial overview of 2013 and discuss events that have had an impact on our investment strategies. I will also provide a report on the performance of the world’s leading markets and a snapshot of the best and worst performing securities. I will then provide a detailed report on the performance of our portfolios with a focus on why they performed so well. Finally, I will conclude with an outlook on markets and the composition of our current portfolios.
Happy reading!
Review of 2013
The expression “Bull Markets Always Climb a Wall of Worry” explains perfectly what happened to us in the markets this year. Fortunately, we ignored negative economic forecasts, which are often too fearful. For the past four years, we have been in what is called a bull market on U.S. exchanges. Trying to predict the next correction is futile in these circumstances. It is much easier to take what the market offers now and adjust later if the trend has changed.
In terms of bad news, U.S. political leaders stole the show once again. Whether it was raising the debt ceiling early in the year, or the near-complete shutdown of the Government of the United States in the last few months of 2013, these events confirm the inability of politicians to make the well-being of the economy a priority. Fortunately, there is no direct link between strictly political decisions and economic growth, except in cases of major crisis. Last year, companies in modern economies reaped historic profits. For example, profits of companies in the S&P 500 were 104% higher than in 2008, and dividends were 62% higher than in 2009. In keeping with this, the table below shows the performance of the major global stock exchanges:

The implementation of Obamacare in the United States in 2013 was another major economic event. This decision had a significant impact on the markets and a direct impact on portfolios. Indeed, the medical and pharmaceutical sector soared throughout the year and helped U.S. markets post some of the largest gains on the planet, as we witnessed. Unfortunately, the woes of the Obamacare website caused serious harm to the CGI Group, which is one of the companies in our portfolios. The stock’s growth stopped abruptly and we sold our shares a few weeks ago. However, we still banked a significant gain of almost 60%. The table below shows the performance of various economic sectors on Canada’s TSX:
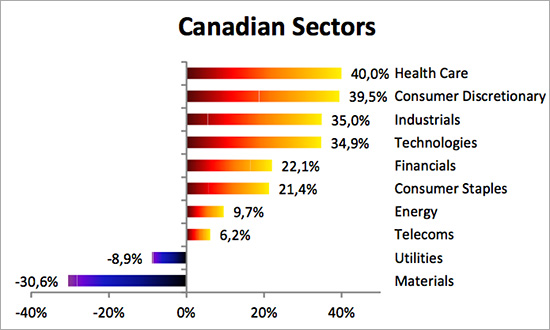
The collapse of the price of gold on the commodities market was yet another major event in 2013. This decline affects us particularly since the resource sector has disproportionate weight on Canadian equity markets. As I have been saying for a few years now, it is always risky to hold securities in a sector that is clearly on a downward trend.
The following are the worst and best performing Canadian securities:


Performance
Net performance as of December 31, 2013
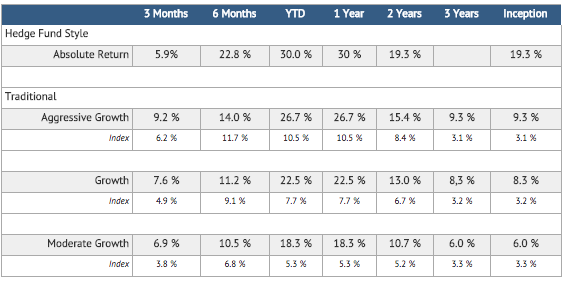
Rates for more than one year are annualized. The indices are based on the performance of XIC – S&P/TSX Capped Composite Index Fund and XBB – DEX Universe Bond Index Funds in the following proportions: Aggressive Growth (90% equities, 10% bonds); Growth (75% equities, 25% bonds); and Moderate Growth (60% equities, 40% bonds).
The yield is calculated net after all costs (management, custody and commissions).
Past performance is no guarantee of future results.
Whether we talk about added value to portfolios, alpha or out-performing the market, this is where we see whether or not our portfolio manager has made sound investment decisions. While past results are not a guarantee of future performance, when all is considered, positive gains are probably the most important variable for the investor. This year again, Rivemont Investments was one of the most successful firms in Canada.
There are three main ways to modify a portfolio relative to its benchmark: change the weighting of asset classes, change the security selection within asset classes, and geographic diversification. Here’s how our portfolios were positioned in 2013.
Weighting of Asset Classes
We had a neutral weighting in equities and were underweight in bonds (more cash). As Canadian bonds were down slightly in 2013, this weighting had a positive effect on the performance of our portfolios. In 2014, we will continue to underweight bonds. In terms of stock, we begin the year with a liquidity ratio above our target because we sold more shares that exceeded expectations in 2013. We should once again be fully invested in the coming weeks.
Security Selection within Asset Classes
Several of the companies we selected, including Descartes Systems, Broadridge and Packaging Corp., yielded between 50 and 100% in 2013 alone. Furthermore, we completely avoided securities linked to resources for the entire year. Technical analysis and monitoring of trends, in my opinion, are an effective way to position ourselves to take advantage of the dramatic increases in certain securities while avoiding significant declines.
Geographical Diversification
In 2013, geographical diversification was the factor that was most critical to our performance. Indeed, focusing aggressively on the U.S. market, either with individual securities or index funds, was very profitable for us. In addition, we avoided declines in several emerging markets. We even managed a quick gain of more than 20% earlier in 2013, with a significant position in the Philippine market before it declined to a neutral position by year-end. We obviously remain on the lookout for interesting international opportunities, despite the fact that many of these markets are characterized by high volatility.
Alternative Management
Although alternative management applies only to a minority of investors, I cannot ignore the 30% yield that we obtained for the “absolute return” strategy. This particular strategy now has an impressive annualized return of nearly 20 %. Over the coming months, Rivemont Investments plans to increase awareness of this style of management, although, at present, it is unfortunately unavailable for certain types of accounts (RRSP, TFSA, etc.).
Market Prospects
| Subjet | Question | Recommendation | Comments |
|---|---|---|---|
| Allocation between equities and fixed income securities. | Which are most interesting, stocks or bonds? | We prefer stocks over bonds. | Since interest rates have started rising again, stocks are most likely to perform better. |
| Distribution between Canadian, U.S. and international. | Which markets are most interesting: Canadian, U.S. or international? | We prefer the U.S. market. | Strong positive trend in U.S. markets |
| Distribution between corporate bonds and government bonds. | Which are more interesting, corporate bonds or government bonds? | We recommend corporate bonds rather than government bonds. | We recommend short- and medium-term corporate bonds as well as high-yield bonds. |
| Investments in Canadian dollars or in foreign currency. | Do investments in other currencies increase or decrease the total yield? | The increase in the Canadian dollar should be modest and insufficient to discourage diversification abroad. | The decline in the Canadian dollar is expected to continue in 2014. |
Favorite Securities
You will find below a list of the eight individual securities with the largest weight in our “growth” portfolio. These stocks were selected based on their respective potential to outperform the stock market. You will find a short description of their activities, the annual dividend, if any, and the total return since their first inclusion in our portfolio.
Dated : January 24, 2014.
1 – Descartes SystemsSymbol: DSG |
5 – RBCSymbol: RY |
2 – Packaging Corporation of AmericaSymbol: PKG |
6 – Globe Specialty MetalsSymbol: GSM |
3 – SterisSymbol: STE |
7 – CitigroupSymbol: C |
4 – Jean-Coutu GroupSymbol: PJC.A |
8 – Great WestSymbol: GWO |
Conclusion
At the risk of repeating myself, I want to thank my customers for continuing to recommend our company to their families and loved ones. Over the past year, assets under our management increased once again by more than 50 % and we now serve investors from across Quebec and in much of Ontario. Obviously, we are committed to maintaining the level of customer service to which you are accustomed. On another note, also be aware that the transfer of assets from TD to the National Bank should take place in June 2014. Do not hesitate to contact us if you have any questions about the transfer.
Rivemont Investments enters its fifth year of operation with the intention of continuing to offer superior performance. We hope to surprise you with new securities with a high growth potential and optimal weighting of asset classes.
Sincerely,
Martin Lalonde, MBA, CFA
President


