

Click here to download the financial newsletter in PDF format.
Introduction
Hello everyone,
The third quarter of the year was a busy one, especially at the corporate level. First, the surprise announcement of the acquisition of TD Waterhouse Institutional Services by National Bank is certainly the measure that will have the greatest impact on our customers and our business processes. Fortunately, it is likely that these effects will be positive since our new trustee and custodian of assets has pledged to invest heavily to improve its already high-performing systems. In addition, some tools already used by the National Bank should help us to monitor our portfolios. Rest assured, of course, that we will monitor the transfer carefully when it takes place.
Second, we believe that Rivemont Investments is one of the most successful investment firms in Canada. However, because our firm is new, many investors are still unfamiliar with our services and our competitive advantages. For this reason, we decided to expand our presence in the mainstream media. I invite you to visit the “Rivemont in the Media” section of our website to read and listen to our latest interventions, particularly on the “À votre service” radio program, which airs on 104.7FM and is devoted exclusively to presenting the private investment services we provide.
In this financial newsletter, I will begin by discussing our performance in the third quarter of 2013, which is usually of the most interest to our readers. After that I will explain what I call sector rotation and risk management. The third segment of the newsletter will be devoted to the presentation of our Absolute Return strategy, an approach that has been gaining popularity because of recent strong gains. As usual, I will conclude with our outlook on markets and the main positions of our current Growth portfolio.
Happy reading!
Performance in the Third Quarter
Net performance as of September 30, 2013
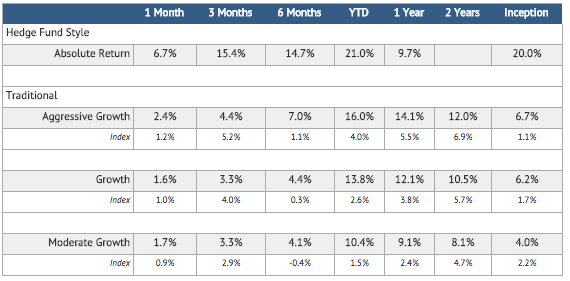
Rates for more than one year are annualized. The indices are based on the performance of XIC – S&P/TSX Capped Composite Index Fund and XBB – DEX Universe Bond Index Funds in the following proportions: Aggressive Growth (90% equities, 10% bonds); Growth (75% equities, 25% bonds); and Moderate Growth (60% equities, 40% bonds).
The yield is calculated net after all costs (management, custody and commissions).
Past performance is no guarantee of future results.
Where our traditional strategies are concerned, the previous quarter was our least successful of the year. The situation could have been worse if it had not been for a strong month of September. Moderate Growth portfolios were the only ones to beat their benchmark. Why? First off, the Canadian market has rebounded considerably, unlike the U.S. market. Secondly, bonds continued their sharp drop, although we were well protected from this downturn. Our bond-heavy portfolios performed well compared to the index. In terms of individual stocks, CGI Group (GIB.A.to) still leads with a total return of 19% in three months. Packaging Corp. (PKG.N) also responded well with a total return of 17% during the same period.
For the Absolute Return strategy, however, this was the best quarter of 2013, with an increase of over 15% in three months, and an overall performance since the beginning of the year of more than 20%.
Sector Rotation and Risk
As I’ve mentioned in the past, I am convinced that it is less risky for investors to focus their portfolios on stocks and sectors with the greatest potential, rather than opting for a simple dictate of general diversification of securities in all sectors. To illustrate this approach, which I call sector rotation, I’d like to use the historical performance of specific sectors (on the U.S. exchanges).

The first thing you notice in this table is the length of the cycles. It is always surprising that a sector that develops momentum, whether bullish or bearish, will continue this trend for several years. That is why in our selection methods, we aim to determine the trend of each stock sector in order to avoid holding assets in the worst performing sectors. To give you an idea of the impact of a negative trend sector, I invite you to examine the annual returns for utilities (Utilities) from 1995 to 1999. This sector is particularly popular with retirees because it usually provides attractive returns due to the higher dividends it generates. However, $100 invested in 1995 was worth only $41 in 1999! If this amount had been invested in the high technology sector over the same period, it would have been worth $265 in 1999.
Far be it for me to say that it is easy to predict which sectors will be most efficient in the future. However, when choosing whether to include a stock in a portfolio, we aim to avoid, as much as possible, an underachiever in an underperforming sector because we know that this situation could persist beyond our planning horizon.
In Canada, we have several excellent examples of areas that have had extremely good results over a long period. The danger is, of course, to believe that these trends will continue indefinitely. The gold sector is a good example, as it demonstrates all the opportunities and risks inherent in a sectoral approach. In June 1999, the price of gold was $263 an ounce. But nobody talked about gold, because everyone focused on a booming high technology sector. The gold sector was dying and companies were investing very little in it. Major central banks around the world were selling their gold, seeing no more advantage to holding on to it. However, in October 2003, the gold sector was up. Just over four years later, the price of an ounce of gold was at $400! The sector was on the rise for more than four years before investors realized its potential. It was the perfect time to integrate this sector into investment portfolios. In fact, because it was on an upward trend, businesses began to undertake value-added projects to cash in on the rising price of the commodity. For eight years, the price of an ounce of gold continued to grow almost continuously until 2011, when prices were around $2,000 an ounce.
Rivemont Investments eliminated gold stocks from its portfolios in 2012. The price of an ounce of gold was down. More importantly, though, the sector had experienced an upward trend for nearly 13 years, which is exceptional. The price of gold is now under $1,300 and we do not expect this sector to bounce back anytime soon. We prefer, instead, to focus on areas that are currently performing. In our opinion, the areas of finance, healthcare and high technology are expected to reach new heights in the coming years, and our portfolios are strategically positioned to enjoy the positive growth results of these sectors. The areas we are avoiding are utilities, real estate and raw materials.
La stratégie à rendement absolu
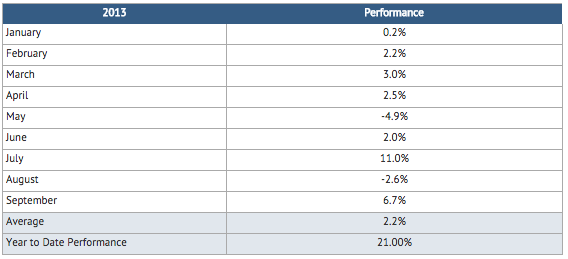
At the beginning of 2012, I announced the creation of the Absolute Return strategy and described it in the following manner: “Combining technical analysis, sector rotation and short selling, the objective of this type of account is to generate positive returns during bull markets AND during bear markets.” The great advantage of this strategy is obviously the ability to generate a positive return even when markets are falling. However, since January 2012, markets remained on a positive trend. Only a few short sales have resulted in positive results of any note. However, since this strategy is for the most risky part of the portfolios of some investors, we have been more aggressive in our choice of stocks since the beginning of the year and it has proved to be more effective. The monthly returns give us an interesting snapshot of the volatility of this strategy.
It goes without saying that this type of management appeals only to a minority of investors. However, we believe it is important to continue to develop products to meet the growing needs of our high net-worth customers.
Market Prospects
| Subjet | Question | Recommendation | Comments | |
|---|---|---|---|---|
| Allocation between equities and fixed income securities. | Which are most interesting, stocks or bonds? | We prefer stocks over bonds. | As interest rates on commercial loans and government loans remain low, stocks are most likely to outperform bonds. | |
| Distribution between Canadian, U.S. and international. | Which markets are most interesting: Canadian, U.S. or international? | We prefer the U.S. market. | We are keeping a close eye on certain emerging markets. | |
| Distribution between corporate bonds and government bonds. | Which are more interesting, corporate bonds or government bonds? | We recommend corporate bonds rather than government bonds. | We recommend short‐ and medium‐term corporate bonds as well as high‐yield bonds. | |
|
Do investments in other currencies increase or decrease the total yield? | The increase in the Canadian dollar should be modest and insufficient to discourage diversification abroad. | The Bank of Canada continues to favor a weaker dollar in order to support the manufacturing sector. |
Favorite Securities
You will find below a list of the eight individual securities with the largest weight in our “growth” portfolio. These stocks were selected based on their respective potential to outperform the stock market. You will find a short description of their activities, the annual dividend, if any, and the total return since their first inclusion in our portfolio.
Dated : October 25, 2013.
1 – CGI GroupSymbol: GIB.A |
5 – Jean-Coutu GroupSymbol: PJC.A |
2 – Broadridge Financial SolutionsSymbol: BR |
6 – SterisSymbol: STE |
3 – Packaging Corporation of AmericaSymbol: PKG |
7 – RBCSymbol: RY |
4 – Descartes SystemsSymbol: DSG |
8 – Chemtrade LogisticsSymbol: CHE.UN |
Conclusion
The third quarter ended on a positive note, with U.S. markets continuing to surprise us, and Canadian markets exceeding expectations, particularly in the areas of finance and energy. With respect to bonds, we continue to believe that the current and future increases in interest rates will prevent this asset class from generating the same level of performance that we experienced over the past three decades. In addition, the stock portion of the portfolios will remain our best defense against possible inflation. Finally, discretionary wealth management gives us the flexibility to respond quickly to unexpected jolts in the financial markets.
Sincerely,
Martin Lalonde, MBA, CFA
President


