

Click here to download the financial newsletter in PDF format.
Introduction
Hello everyone,
The second quarter of 2013 went fairly smoothly and resulted in a positive yield for our customers despite Canadian bond and stock markets dropping by 3% and 5% respectively. Many people ask me how it is possible to obtain a positive return when the market does not perform well. I have dedicated a portion of this newsletter to the variables that absolutely must be considered by a portfolio manager in order to obtain higher than market returns. If you are not already a customer of ours, this is a great opportunity to check if your portfolio is structured in a manner to increase potential returns.
In addition, in this issue I will review the previous quarter and outline our good and less good moves. I have also included an interesting table that provides a snapshot of what savings objectives should be for those who do not contribute to a generous pension plan. I will end with the usual presentation of our outlook on the markets and the main securities that constitute our portfolios.
Happy reading.
Second Quarter
Net performance as of June 30, 2013

Rates for more than one year are annualized. The indices are based on the performance of XIC – S&P/TSX Capped Composite Index Fund and XBB – DEX Universe Bond Index Funds in the following proportions: Aggressive Growth (90% equities, 10% bonds); Growth (75% equities, 25% bonds); and Moderate Growth (60% equities, 40% bonds). The yield is calculated net after all costs (management, custody and commissions). Past performance is no guarantee of future results.
What we were expecting for a long time has finally materialized: the bond market collapsed while the Canadian bond benchmark index fell more than 3% in the quarter. Although this decline seems small in absolute terms, it should not be forgotten that these bonds are usually the conservative part of a portfolio. Fortunately, our portfolios are underweight in bonds and those we hold should lose less value when interest rates begin to rise. In addition, we avoid long-term government bonds because they have the potential to produce net negative returns.
Where stocks are concerned, the Canadian market fell by 4.9%, while the U.S. market rose by 2.4%. This substantial difference is largely explained by the significant decline in commodity prices such as gold and silver. Indeed, an ounce of gold that was trading at more than $1,800 several months ago is worth less than $1,350 today. And given that the Canadian market is less diversified, this decline had a larger impact on this side of the border.
For our part, the securities we chose have performed as we hoped and it is for this reason that our portfolios continue to produce positive results. Our average yield has outperformed the benchmark by more than 10% since the beginning of the year! Of particular note in the last quarter are the performance of Descartes Systems (DSG.to) + 27.2%, CGI Group (GIB.A.to) +11.6% and Jean-Coutu (PJC.A.to) + 12.2%.
Potential to Outperform the Market
Although there is no way to ensure a higher return than the market, there are several ways to guarantee a lower-than-market yield. In the following section, I will outline the portfolio variables that offer the highest yield potential.
Different Assets than the Market
There is no advantage to having identical holdings to those in the index unless you are a passive investor. We are not opposed to owning index funds. I myself use these financial tools for some of the accounts under our management. However, the core of the portfolio must be different from that of the index in order for the return to be different. One cannot expect better performance if the holdings are the same. For example, consider the comparison between the ten stocks with the largest weight in the Toronto Stock Exchange Index and the ten largest holdings in a large mutual fund managed by a major Canadian bank:
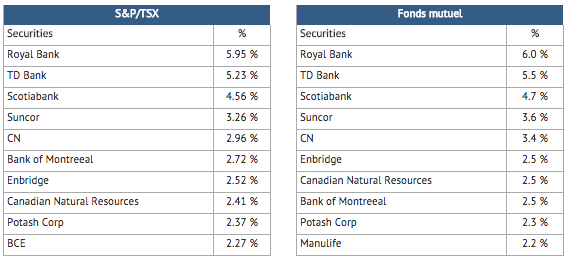
It should be immediately apparent that the major Canadian bank’s mutual fund will never outperform the market since its composition is nearly identical to the index. Taking into account the annual management fee of many mutual funds, these are very inefficient investment vehicles. Nevertheless, the fact that more than $5 billion are invested in the above-listed mutual fund is, in my opinion, a travesty. An investment advisor who proposes to invest in this mutual fund rather than an index fund, which is four times cheaper in terms of management fees, cannot have the interests of their customers at heart…
Reasonable Management Fees
In the case of management fees, there is a general rule to follow if you hope to outperform the market. In Canada, an investor should never pay more than 2% in annual fees. If management costs are higher than 2%, it is next to impossible to outperform the market.
Effective Diversification
In general, a portfolio should be well diversified, which means that no stock or bond should occupy too much space in the portfolio to avoid influencing overall performance in a disproportionate manner. This being said, one of the biggest investment mistakes being made in Canada these days is the excessive diversification of assets, which results in a portfolio that looks too similar, once again, to the entire index. The S&P/TSX index consists of 237 securities, all or any of which can be included in a portfolio. Some funds, such as the one mentioned above, holds more than 100 securities! In my opinion, it is unwise to invest in its 100th best security just for the sake of diversification. It makes more sense to focus on the best stocks in order to build a successful portfolio.
Financial Retirement Goals (1)
(1) ASTON, Davis, MoneySense, Special Retirement Guide, 2013
My clients often ask me how much money they will need in retirement. The answer to this question varies greatly depending on an individual or couple’s financial situation and what lifestyle they hope to have in retirement. A comprehensive review is usually necessary. The table below provides a general idea of what you might need (in current dollars). Once these funds are set aside, it is necessary to generate strong returns on the market, which is where Rivemont Investments can help.
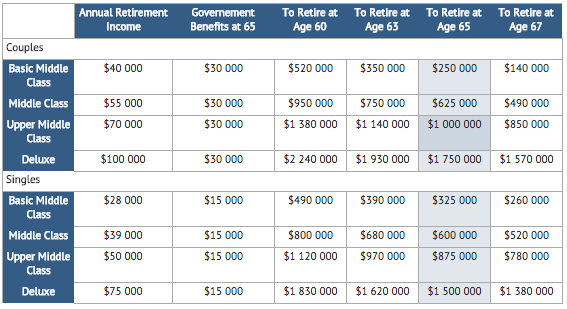
The amount needed depends on the kind of lifestyle a retiree hopes to have in retirement. The “Basic Middle Class” category represents a couple who can afford to purchase a used car every 8 years, will mostly travel locally (by car) and will rarely go abroad. Couples in the “Middle Class” category would be able to afford a new car every 8 years and a few trips abroad, while those in the “Upper Middle Class” category would be able to afford a new car every 5 years or two cars every 8 years, and undertake more luxurious travel in retirement.
Market Prospects
| Subjet | Question | Recommendation | Comments |
|---|---|---|---|
| Allocation between equities and fixed income securities. | Which are most interesting, stocks or bonds? | We prefer stocks over bonds. | As interest rates on commercial loans and government loans remain low, stocks are most likely to outperform bonds. |
| Distribution between Canadian, U.S. and international. | Which markets are most interesting: Canadian, U.S. or international? | We prefer the U.S. market. | We still avoid certain European markets due to sovereign debt risks. |
| Distribution between corporate bonds and government bonds. | Which are more interesting, corporate bonds or government bonds? | We recommend corporate bonds rather than government bonds. | We recommend short‐ and medium‐term corporate bonds as well as high‐yield bonds. |
| Investments in Canadian dollars or in foreign currency. | Do investments in other currencies increase or decrease the total yield? | The increase in the Canadian dollar should be modest and insufficient to discourage diversification abroad. | We avoid investments in Euros, because of the risk of devaluation. |
Favorite Securities
You will find below a list of the eight individual securities with the largest weight in our “growth” portfolio. These stocks were selected based on their respective potential to outperform the stock market. You will find a short description of their activities, the annual dividend, if any, and the total return since their first inclusion in our portfolio.
Dated : July 26, 2013.
1 – CGI GroupSymbol: GIB.A |
5 – Packaging Corporation of AmericaSymbol: PKG |
2 – Jean-Coutu GroupSymbol: PJC.A |
6 – Broadridge Financial SolutionsSymbol: BR |
3 – Descartes SystemsSymbol: DSG |
7 – Chemtrade LogisticsSymbol: CHE.UN |
4 – SterisSymbol: STE |
8 – RBCSymbol: RY |
Conclusion
I am pleased to invite you to tune in to 104.7 FM Outaouais each morning and evening throughout the summer, where I provide commentary on investment and the economy. This is an interesting new challenge for me and I thank the station for giving me this opportunity.
Finally, if you are not yet one of our valued customers, do not hesitate to contact us so that we can determine together how Rivemont Investments can help you achieve your financial goals. We are the only private wealth management firm in the Outaouais region and unquestionably one of the most successful investment firms in eastern Canada.
Rivemont Investments, because performance is important.
Sincerely,
Martin Lalonde, MBA, CFA
President


